-
(인문학) 지구 대기권 (한글+영문 자료)사람되기/인문학 2015. 10. 31. 19:10
출처: https://ko.wikipedia.org/wiki/%EC%A7%80%EA%B5%AC_%EB%8C%80%EA%B8%B0%EA%B6%8C
지구 대기권
위키백과, 우리 모두의 백과사전.지구 대기권(地球大氣圈)은 지구를 둘러싸고 있는 대기를 일컬으며 고도에 따라서 생기는 중력의 차이와 구성분자의 밀도에 따라서 여러 층으로 나누어 볼 수 있으며 각각의 층은 고도에 따라서 기온이 차가 심한 것을 관측할 수 있다. 이와 함께 대기권은 비록 미소하지만 전자량에 따라서 전하가 가능한 전리층과 이것이 거의 없는 중성층으로 나누어 볼 수도 있다.
지구 대기권의 구분[편집]
지구 대기권은 특성에 따라 지표면에서부터 대류권, 성층권, 중간권, 열권, 외기권의 다섯 층으로 나눌 수 있다.
대류권[편집]
대류권은 지표면에 가장 인접한 대기의 층이다. 대류권은 지표면의 복사열에 의해 가열되므로, 고도가 높아질수록 온도는 낮아진다. 즉 온도가 높은 공기가 아래쪽에 있으며, 이는 열역학적으로 매우 불안정하므로 쉽게 난류와 기상현상이 발생한다. 대류권에는 무거운 공기 분자가 모여있으며, 전체 대기 질량의 거의 80%가 모여있다. 대류권은 극지방에서는 지표면으로부터 7–8 km 정도 까지의 영역이며, 적도지방에서는 더 높아 18 km 정도까지의 영역이다.
성층권[편집]
성층권은 대류권과 반대로 지상에서 올라갈수록 온도가 상승한다. 성층권의 가열 원인은 오존으로, 오존이 태양으로부터의 자외선을 흡수함에따라 가열되며, 따라서 고도가 높아질수록 온도는 상승하게 된다. 온도가 높은 공기가 위에 있으므로 열역학적으로 안정하며, 이러한 이유로 난류가 발생하지 않으므로, 비행기 고도(11–13 km)로 이용되기도 한다. 성층권은 대류권 위쪽에 위치하며, 대략 지표면으로부터 50 km 정도까지의 영역이다.
중간권[편집]
중간권은 다시 고도가 올라갈수록 온도가 감소하는 영역이다. 이 영역에서는 대류현상이 일어나 약간의 구름이 형성되기도 하지만 기상현상은 일어나지 않는다. 지상 50 km에서 80 km까지의 높이이며, 야광운이 생기기도 한다.
열권[편집]
열권은 중간권 상부의 층으로, 올라갈수록 기온이 상승한다. 그 이유로는, 열권의 밀도가 매우 낮기 때문에, 적은 열로도 온도가 많이 올라가기 때문이다. 또 다른 이유로는, 태양에 가깝기 때문이라는 이유도 있지만 큰 영향력을 받지는 않는다. 이곳에서는 강력한 태양풍을 직접 맞아서 원자가 전리화되기 때문에 전리층으로 불리기도 한다. 강한 전리층은 전파를 반사하며, 이러한 반사 현상을 이용하여 원거리 무선통신을 하기도 한다. 지상 80–90 km에서 시작하여 500–1000 km까지의 높이이며, 오로라가 생기기도 한다.
외기권[편집]
외기권은 지구 대기가 우주 공간과 접하는 최외곽 영역이다. 이 곳에 존재하는 대부분의 가스는 수소와 헬륨이며, 우주공간으로 빠져나가기도 한다. 외기권은 500–1000 km 상공에서 시작하며, 끝나는 지점은 특별한 의미는 없지만 10,000 km 정도까지로 생각하기도 한다.
그 밖의 층[편집]
크게 온도로 구별되는 5개의 층과 함께, 몇몇의 두 번째 층이 다른 특성에 의해서 구별된다.
- 오존층은 생명체에게 해로울 수 있는 단파 자외선을 97~99%가량 흡수한다. 지구 대기의 오존 가운데 90% 이상이 여기에 있다.
- 전리층은 태양으로부터 오는 복사에 의해서 대기가 이온화된 영역으로 오로라가 일어나는 층이다. 전리층은 낮 시간동안 50~1,000km(31~621마일; 160,000~3,280,000피트)까지 확장되고, 중간권, 열권, 그리고 외권의 일부를 포함하고 있다. 하지만, 밤 시간 동안 중간권에서의 이온화는 멈추고, 그렇기 때문에 일반적인 오로라가 오직 열권과 외권의 낮은부분에서 일어난다. 전리층은 자기권의 안쪽 가장자리를 형성하는데, 이는 예를 들어, 라디오파의 지구로의 전달에 있어서 영향을 미치기 때문에 중요하게 다루어진다.
- 균질권과 비균질권은 대기의 가스가 잘 섞여 있는지 아닌지에 의해서 정의된다. 균질권의경우 대류권, 성층권, 중간권과 열권의 극소량 부분에서는 대기의 화학적 성분은 난류에 의해서 가스가 섞여있기 때문에 분자의 무게에 의존하지 않는다. 이러한 상대적인 균질권층은약 해발100km(62마일; 330,000피트) 지점인 난류권계면에서 끝난다. 이보다 높은 고도에는 열권의 대부분과 외권을 포함한 비균질권이 존재한다. 이 층의 화학적 성분은 고도에 따라 다양하다. 이는 섞여있는 상태보다 분자들 간의 충돌이 없이 이동할 수 있는 거리가 더 크기 때문이다. 이는 산소와 질소와 같은 무거운 분자들에게 비균질권의 바닥에만 존재하도록 계층화하기 때문이다.
- 행성간의 경계는 주로 난류 확산의 영향을 직접적으로 받는 지구의 표면에 가까이에 있는 열권의 일부분이다. 낮 시간동안 행성간의 경계는 일반적으로 잘 섞이지만, 반면에 낮 시간에는 안정적으로 계층화되기 시작한다. 행성간의 경계의 두께는 얇을때는 100m, 잔잔한 밤에는 3,000m 또는 오후의 건조한 영역에서는 더 두껍다.
지구 표면에 있는 대기의 평균 온도는 14도 이다.
지구 대기권의 구성 물질[편집]
지구 대기권 구성 물질의 부피 비율 종류 부피 질소 (N2) 78.084% 산소 (O2) 20.946% 아르곤 (Ar) 0.9340% 이산화탄소 (CO2) 365 ppmv[1] 네온 (Ne) 18.18 ppmv[1] 헬륨 (He) 5.24 ppmv[1] 메탄 (CH4) 1.745 ppmv[1] 크립톤 (Kr) 1.14 ppmv[1] 수소 (H2) 0.55 ppmv[1] 수증기 (H2O) [2] 일반적으로 1% 위 표에 언급되지 않은 미미한 분자
종류 부피 일산화질소 (NO) 0.5 ppmv[1] 제논 (Xe) 0.09 ppmv[1] 오존 (O3) 0.0-0.07 ppmv[1]
(겨울에는 0.0-0.02 ppmv[1])이산화질소 (NO2) 0.02 ppmv[1] 아이오딘 0.01 ppmv[1] 일산화탄소 (CO) 극미량 암모니아 극미량 물리학적 특징[편집]
압력과 두께[편집]
해수면에서의 평균적인 대기압은 1이다. 대기의 전체 질량은 5.1480×10^18 kg (1.135×10¹⁹ lb)는 평균해수면의 압력과 지구의 산악지형의 51007.2 메가 헥타르에 해당하는 양보다 약 2.5%가량 낮을 것으로 추정된다. 지구 대기의 기압은 압력이 측정된 어떤 지점 위의 전체 무게이다. 따라서 기압은 지역과 날씨에 따라 다양하다.
만약 해수면으로부터 지구의 전체 대기가 특정한 밀도를 가진다면, 이는 8.5km 지점에서 갑자기 끝날 것이다. 이것은 실제로는 고도에 따라 기하급수적으로 감소하고, 모든 5.6km지점에서는 절반이거나 성분에 의해 7.64km에서 절반이 된다. 그러나, 대기는 각 층마다 온도, 분자 성분, 태양복사, 중력요소에 있어서 일정한 변화량을 가진다.
다시 말해서, 지구 대기의 질량은 다음과 같이 적절히 구별되어 있다.
●50%는 5.6km 이하에 존재한다 . ●90%는 16km 이하에 존재한다.
●99.99997%는 ‘Kármán line’라고 불리는 100km이하에 존재한다. 국제 협약에 따르면 이 곳은 우주 비행사들이 여행할 것으로 여겨지는 우주의 시작점으로 지정되었다. 에베레스트 산의 정상은 8,848m인데 반해서, 민간 항공기는 연료를 절약할 수 있는 10km와 13km사이를 운항한다.
심지어 Kármán line 위에는 오로라같은 기상학적으로 중요한 현상이 일어난다. 이 구간에서는 유성이 빛나긴 하지만 더 큰 유성의 경우는 더 깊게 진입하지 않는 이상 타지 않는다. 100km에서 500km이상의 지구의 다양한 전리층은 HF 라디오의 전파에 있어서 중요하다. 그에 반해, 국제 우주 정거장과 우주 왕복선은 일반적으로 대기 방해물이 존재하여 몇 달마다 재가동 시켜줘야 하는 전리층의 F층이 공존하는 350~400km의 고도에 존재한다. 태양 활동에 따라서 700~800km의 높은 고도에 있는 인공위성 또한 대기 방해물의 영향을 받을 수 있다.
온도와 음속[편집]
각 층은 대부분 온도에 의해서 분할될 것이라고 논의된다. 온도는 해발고도가 낮아짐과 동시에 감소하지만, 이러한 경향은 온도가 안정화된 대류권의 나머지부분을 통해 큰 수직거리인 11km이상에서 변화되기 시작한다. 20km이상의 성층권에서는 오존층에 존재하는 산소와 오존가스들이 태양으로부터 오는 상당한 양의 자외선을 흡수하기 때문에 고도가 올라감에 따라서 온도도 증가한다. 또한 열권이라는 이름이 붙여진 90km이상의 지역에서도 고도가 올라갈수록 온도가 같이 증가하는 구역이 존재한다. 이상기체에서의 음속은 가스의 압력이나 밀도에 의존하지않고 온도에만 의존하기 때문에, 고도에 따른 대기에서의 음속은 온도와 복잡한 관계를 가지고, 고도에 따른 밀도와 압력의 변화는 반영하지 않는다.
밀도와 질량[편집]
해수면에서의 공기의 밀도는 약 1.2kg/m³ 이다. 밀도는 직접적으로 측정하지 않고, 온도, 압력, 습도의 측정값을 기체의 상태 방정식에 대입하여 계산한 것이다. 대기의 밀도는 고도가 올라감에 따라 감소한다. 이러한 변화는 기압에 관한 방정식을 사용함에 있어서 적절한 모델이 될 수 있다. 더 복잡한 모델은 인공위성의 부식을 예측하는데 사용된다.
대기의 평균 질량은 약 5×10¹⁵톤 또는 지구 질량의 1/1,200,000 이다. 미국의 국립 대기과학 연구소는 다음과 같이 말하였다.“전체 평균 질량인 5.1480×10¹⁸kg은 표면의 압력 또는 수증기의 양에 의존하는 1.2 또는 1.5×10¹⁵kg의 수증기 때문에 약간의 변화가 있다. 수증기의 평균질량은 1.27×10¹⁶kg으로 측정 되었고 건조한 공기의 질량은 (5.1352±0.0003)×10¹⁸kg이다.”
광학적 특성[편집]
태양복사(또는 햇빛)는 태양으로부터 지구에 도달하는 에너지이다. 지구 또한 복사방출을 일으키긴 하지만, 우리 눈에 보이지 않을 정도로 파장이 길다. 들어오거나 방출되는 복사는 지구 대기에 의해서 흡수되거나 반사된다.
산란[편집]
빛이 대기를 통과 할 때, 대기와 광자가 서로 상호작용하여 빛이 산란된다. 만약 빛이 대기와 서로 상호작용을 하지 않는다면, 이는 직접방사선이라 불리고 이는 마치 태양을 직접적으로 보는 것과 같게 보인다. 간접적방사능은 대기에서 산란된 빛이다. 예를 들어, 그림자가 보이지 않을 정도로 흐린 날에는 전부 산란되기 때문에 직접방사능이 도달하지 않는다. 또 다른 예를 들자면, 레일리 산란 효과에 의해서 짧은 파장의 빛은 긴 파장의 빛보다 더 쉽게 산란되는데, 이는 하늘이 파란색으로 보이는 이유이다.(우리는 산란된 빛을 보고 있다.) 또한 이것은 어째서 노을이 붉은지에 대한 이유이기도 하다. 왜냐하면, 태양이 지평선에 가까워지면, 태양의 빛은 평소보다 더 많은 대기를 통과하게 되는데, 이때 대부분의 청색 빛은 산란되어 날아가고, 붉은 빛이 노을에 남아있게 되기 때문이다.
흡수[편집]
서로 다른 분자들은 서로 다른 파장의 빛을 흡수한다. 예를 들자면, O₂와 O₃는 300nm보다 짧은 파장을 대부분 흡수한다. 물은 700nm이상의 대부분의 파장을 흡수한다. 분자가 광자를 흡수할 때, 분자의 에너지가 증가하게 된다. 이는 대기의 온도를 가열하지만, 이전에 언급한 대로 복사를 방출하면서 여전히 냉각된다. 대기중의 가스의 합쳐진 흡수선은 특정된 띠만을 나타나게 하도록 하는 창을 남기게 된다. 광학적 창은 약 300nm에서부터 인간이 볼 수 있는 가시광선인 400~700nm는 물론 적외선의 약 1100nm까지를 포함한다. 또한 적외선과 라디오파와 같이 긴 파장을 전달시키는 전파의 창이 존재한다. 예를 들어, 전파의 창은 약 1cm에서부터 약 11m까지의 파장을 포함한다.
방출[편집]
방출은 흡수의 반대로, 이는 물체가 복사를 방출할 때 일어난다. 물체는 흑체복사의 곡선을 따라서 복사를 일으키려 하는 경향이 있으므로, 뜨거운 물체는 짧은 파장의 복사를 더 많이 방출한다. 차가운 물체는 긴 파장의 복사를 더 적게 방출한다. 예를 들자면, 태양의 온도는 대략 6,000K이고, 태양의 복사는 500nm의 파장 근처에서 최대치를 이루기 때문에 인간의 눈에 보일 수 있다. 반면, 지구의 온도는 대략 290K이고, 지구 복사는 10,000nm의 파장 근처에서 최대치를 이루는데, 이는 인간이 볼 수 있는 파장보다 훨씬 길다. 온도 때문에 대기는 적외선을 복사로 방출한다. 예를 들어, 맑은 날 밤에 지구의 표면은 흐린 날보다 빠르게 식는다. 이는 구름에 포함된 H₂O가 열을 많이 흡수하고 적외선의 형태로 복사를 일으키기 때문이다. 이는 밤에 고도가 높은 곳보다 낮은 곳이 더 추운 이유이다. 온실효과는 흡수와 방출효과에 있어서 직접적인 연관이 있다. 대기에 있는 일부의 가스들은 적외선을 흡수하고 방출하지만, 햇빛에 있는 가시광선과는 상호작용을 하지 않는다. 일반적인 예로 CO₂와 H₂O가 있다.
굴절률[편집]
공기의 굴절률은 1에 가깝지만 1보다는 크다. 굴절률의 체계적인 변화는 긴 광로를 통해 날아오는 빛을 굴절시키게 된다. 한 가지 예를 들면, 몇몇의 상황 하에서 배에 탑승해 있는 관측자는 수평선 바로위에서 다른 선박을 볼 수 있는데, 이는 지구표면의 곡률에 의해서 같은 경로상에 있는 빛이 굴절되기 때문이다. 공기의 굴절률은 온도에 의존하고, 온도의 변화량이 클 때 귤절 효과는 증가하게 된다. 이와 같은 효과에 의한 예로는 신기루가 있다.
순환[편집]
대기의 순환은 대류권에서 일어나는 거대한규모의 공기들의 움직임이고, 이는 열을 지구 전역에 배분하기 위한 수단이다. 이러한 대기의 대규모 구조의 순환은 매년마다 다르지만, 기본적인 구조는 지구의 자전주기와 적도와 극지방 사이의 태양복사의 차이에 의해서 결정되기 때문에 거의 일정하다.
지구 대기의 진화과정[편집]
원시 대기[편집]
처음의 대기는 태양 성운에 존재하는 주로 수소에 의해서 구성 되었다. 거기에 더해, 아마도 현재는 목성이나 토성과 같은 거대한 가스에서 발견되는 주로 수증기나, 메탄과 암모니아와 같은 간단한 형태의 수소화물이 존재했을 것이다. 태양 성운이 사라지고 나서부터는 이러한 가스들은 태양풍에 의해 부분적으로 날아가 버렸다.
두 번째 대기[편집]
그 다음의 대기는 많은 양의 질소와 이산화탄소, 비활성 기체가 화산 폭발에 의해 공급되거나 소행성에 의한 거대한 충돌 동안 공급되었다. 이로 인해 방출된 엄청난 양의 이산화탄소는 곧바로 물에 녹아서 탄산염퇴적물을 형성하였다. 물과 관련된 퇴적물들은 38억 년 전부터의 것부터 형성되어 왔다. 약 34억 년 전의 질소는 안정된 상태의 두 번째 대기의 대부분의 부분을 차지하고 있었다. 생명체에 대한 영향은 생명체는 대기보다 빠른 시기인 약 35억 년 전부터 형성되었기 때문에 다시 한 번 고려해봐야 한다. 원시 태양이 현재보다 30% 적은 양의 에너지를 방출하는 그 시대에 어떻게 지구가 액체상태의 물과 생명이 존재 할 수 있도록 기후를 따뜻하게 유지하였는지가 ‘젊을수록 어두운 태양의 역설’ 이라고 불리게 된 문제이다. 하지만 지질학적 기록은 완전한 상태의 지구의 따뜻한 표면과 약 24억 년 전의 빙하시기의 예상과의 지속적인 연관성을 보여준다. 시생대 시대의 말에 27억 년 전의 스트로마톨라이트 화석에서 발견된 남조류에 의한 광합성을 통해서 공급된 산소를 포함한 대기가 성장하기 시작했다. 초기의 기본적인 탄소 동위원소는 현재의 것과 매우 유사한 비율을 가지는데, 이는 기본적인 탄소 순환의 특징은 약 40억 년 전부터 이미 안정되었다는 것을 제시한다. 지구의 유동적인 산화의 진행과정은 약 21.5억년~20.8억 년 전의 가봉 공화국으로부터의 오래된 퇴적물에 기록되어 있다. 이러한 산화의 변동은 Lomagundi carbon isotope excursion에 의한 기반을 뒀을 것이다.
세 번째 대기[편집]
판 구조론에 의한 끊임없는 성분의 재배열과 지각의 탄산염 광맥으로부터의 이산화탄소 이동은 대기의 오랜 기간 동안의 진화 과정에 영향을 주었다. 활성산소는 약 24억 년 전 산소 급증 사건이 일어나기 전에는 존재하지 않았으나, 활성산소의 출현은 안정되어 있던 철 광맥의 종말을 나타냈다. 이 시기 이전에는 광합성을 통해 공급된 어떠한 산소도 환원되어 있던 주로 철과 같은 금속광물과 산화반응에 의한 소비를 일으키지 않았다. 대기 속의 활성산소의 분자들은 산소의 생산률이 환원되는 금속광물을 초과하기 전까지 모여들지 않았다. 이는 환원성 대기로부터 산화성 대기로의 흐름을 나타낸다. O₂는 선캄브리아대의 말기까지 15%이상의 O₂분자가 안정된 상태에 도달하기까지 다양한 변화를 보여주었다. 약 5.41억 년 전부터의 기간은 호기성생물의 출현이 시작된 캄브리아기의 초기시대인 현생대이다. 대기 중의 산소의 양은 6억 년 전부터 변동을 거듭하여 2.8억 년 전에는 현재의 수치인 21%보다 상당히 높은 약30%로 최고치에 도달하였다. 두 가지의 주요 과정들이 대기의 변화를 지배하였다. 하나는 식물들이 대기 중의 이산화탄소를 사용하고 산소를 배출하는 것이다. 또 다른 하나는 황철석의 붕괴와 화산 폭발로 인해서 대기로 유입된 산화된 황에 의한 대기 중의 막대한 양의 산소의 환원이다. 그러나, 화산 분출은 또한 식물이 산소로 바꿀 수 있는 이산화탄소를 방출시켰다. 대기 중의 막대한 양의 산소변화의 정확한 원인은 아직 알려지지 않았다. 대기중에 산소가 많은 기간 동안 동물의 진화를 촉진시켰을 것이라고 추정하고 있다. 현재의 대기는 동물의 진화과정을 촉진시키기에 충분한 약 21%의 산소를 함유하고 있다. 최근에, 지구 온난화를 유발시키는 주범인 인류 개변의 온실가스는 대기에 축적되고 있다.
대기 오염[편집]
대기오염은 유기체에 해가되거나 불편함을 일으키는 대기중의 화학물질, 미립자, 또는 유기물질에 대한 소개이다. 성층권의 오존량 감소는 대기 오염에 의한 것으로 믿어지고 있다.
같이 보기[편집]
각주[편집]
바깥 고리[편집]

위키미디어 공용에 관련 미디어 분류가 있습니다. [보이기] 지구 대기권[보이기] 대기권출처: https://en.wikipedia.org/wiki/Atmosphere_of_Earth
Atmosphere of Earth
From Wikipedia, the free encyclopediaThe atmosphere of Earth is the layer of gases surrounding the planet Earth that is retained by Earth's gravity. The atmosphere protectslife on Earth by absorbing ultraviolet solar radiation, warming the surface through heat retention (greenhouse effect), and reducingtemperature extremes between day and night (the diurnal temperature variation).
The common name air (English pronunciation: /ɛər/) is given to the atmospheric gases used in breathing and photosynthesis. By volume, dry air contains 78.09% nitrogen, 20.95% oxygen,[1] 0.93% argon, 0.039% carbon dioxide, and small amounts of other gases. Air also contains a variable amount of water vapor, on average around 1% at sea level, and 0.4% over the entire atmosphere. Air content andatmospheric pressure vary at different layers, and air suitable for the survival of terrestrial plants and terrestrial animals is found only in Earth's troposphere and artificial atmospheres.
The atmosphere has a mass of about 5.15×10¹⁸ kg,[2] three quarters of which is within about 11 km (6.8 mi; 36,000 ft) of the surface. The atmosphere becomes thinner and thinner with increasing altitude, with no definite boundary between the atmosphere and outer space. The Kármán line, at 100 km (62 mi), or 1.57% of Earth's radius, is often used as the border between the atmosphere and outer space. Atmospheric effects become noticeable during atmospheric reentry of spacecraft at an altitude of around 120 km (75 mi). Severallayers can be distinguished in the atmosphere, based on characteristics such as temperature and composition.
The study of Earth's atmosphere and its processes is called atmospheric science (aerology). Early pioneers in the field include Léon Teisserenc de Bort and Richard Assmann.[3]
Composition
Air is mainly composed of nitrogen, oxygen, and argon, which together constitute the major gases of the atmosphere. Water vapor accounts for roughly 0.25% of the atmosphere by mass. The concentration of water vapor (a greenhouse gas) varies significantly from around 10 ppmv in the coldest portions of the atmosphere to as much as 5% by volume in hot, humid air masses, and concentrations of other atmospheric gases are typically provided for dry air without any water vapor.[4] The remaining gases are often referred to as trace gases,[5] among which are the greenhouse gases such as carbon dioxide, methane, nitrous oxide, and ozone. Filtered air includes trace amounts of many other chemical compounds. Many substances of natural origin may be present in locally and seasonally variable small amounts as aerosols in an unfiltered air sample, including dust of mineral and organic composition, pollen and spores, sea spray, and volcanic ash. Various industrial pollutants also may be present as gases or aerosols, such as chlorine (elemental or in compounds),fluorine compounds and elemental mercury vapor. Sulfur compounds such as hydrogen sulfide and sulfur dioxide (SO2) may be derived from natural sources or from industrialair pollution.
Major constituents of dry air, by volume[6] Gas Volume(A) Name Formula in ppmv(B) in % Nitrogen N2 780,840 78.084 Oxygen O2 209,460 20.946 Argon Ar 9,340 0.9340 Carbon dioxide CO2 397 0.0397 Neon Ne 18.18 0.001818 Helium He 5.24 0.000524 Methane CH4 1.79 0.000179 Not included in above dry atmosphere: Water vapor(C) H2O 10–50,000(D) 0.001%–5%(D) notes: (A) volume fraction is equal to mole fraction for ideal gas only,
also see volume (thermodynamics)
(B) ppmv: parts per million by volume
(C) Water vapor is about 0.25% by mass over full atmosphere
(D) Water vapor strongly varies locally[4]Structure of the atmosphere
Principal layers
In general, air pressure and density decrease with altitude in the atmosphere. However, temperature has a more complicated profile with altitude, and may remain relatively constant or even increase with altitude in some regions (see the temperature section, below). Because the general pattern of the temperature/altitude profile is constant and recognizable through means such as balloon soundings, the temperature behavior provides a useful metric to distinguish between atmospheric layers. In this way, Earth's atmosphere can be divided (called atmospheric stratification) into five main layers. Excluding the exosphere, Earth has four primary layers, which are the troposphere, stratosphere, mesosphere, and thermosphere.[7] From highest to lowest, the five main layers are:
- Exosphere: 700 to 10,000 km (440 to 6,200 miles)
- Thermosphere: 80 to 700 km (50 to 440 miles)[8]
- Mesosphere: 50 to 80 km (31 to 50 miles)
- Stratosphere: 12 to 50 km (7 to 31 miles)
- Troposphere: 0 to 12 km (0 to 7 miles)[9]
Exosphere
The exosphere is the outermost layer of Earth's atmosphere (i.e. the upper limit of the atmosphere). It extends from the exobase, which is located at the top of the thermosphere at an altitude of about 700 km above sea level, to about 10,000 km (6,200 mi; 33,000,000 ft). The exosphere merges with the emptiness of outer space, where there is no atmosphere.
This layer is mainly composed of extremely low densities of hydrogen, helium and several heavier molecules including nitrogen, oxygen and carbon dioxide closer to the exobase. The atoms and molecules are so far apart that they can travel hundreds of kilometers without colliding with one another. Thus, the exosphere no longer behaves like a gas, and the particles constantly escape into space. These free-moving particles follow ballistic trajectories and may migrate in and out of the magnetosphere or the solar wind.
The exosphere is located too far above Earth for any meteorological phenomena to be possible. However, the aurora borealis and aurora australis sometimes occur in the lower part of the exosphere, where they overlap into the thermosphere. The exosphere contains most of the satellites orbiting Earth.
Thermosphere
The thermosphere is the second-highest layer of Earth's atmosphere. It extends from the mesopause (which separates it from the mesosphere) at an altitude of about 80 km (50 mi; 260,000 ft) up to thethermopause at an altitude range of 500–1000 km (310–620 mi; 1,600,000–3,300,000 ft). The height of the thermopause varies considerably due to changes in solar activity.[8] Because the thermopause lies at the lower boundary of the exosphere, it is also referred to as the exobase. The lower part of the thermosphere, from 80 to 550 kilometres (50 to 342 mi) above Earth's surface, contains the ionosphere.
This atmospheric layer undergoes a gradual increase in temperature with height. Unlike the stratosphere, wherein a temperature inversion is due to the absorption of radiation by ozone, the inversion in the thermosphere occurs due to the extremely low density of its molecules. The temperature of this layer can rise as high as 1500 °C (2700 °F), though the gas molecules are so far apart that its temperature in the usual sense is not very meaningful. The air is so rarefied that an individual molecule (of oxygen, for example) travels an average of 1 kilometre (0.62 mi; 3300 ft) between collisions with other molecules.[10]Even though the thermosphere has a very high proportion of molecules with immense amounts of energy, the thermosphere would not feel hot to a human in direct contact, because the low density in the thermosphere would not be able to conduct a significant amount of energy to or from the skin. In other words, a person would not feel warm because of the thermosphere's extremely low pressure.
This layer is completely cloudless and free of water vapor. However non-hydrometeorological phenomena such as the aurora borealis and aurora australis are occasionally seen in the thermosphere. TheInternational Space Station orbits in this layer, between 320 and 380 km (200 and 240 mi).
Mesosphere
The mesosphere is the third highest layer of Earth's atmosphere, occupying the region above the stratosphere and below the thermosphere. It extends from the stratopause at an altitude of about 50 km (31 mi; 160,000 ft) to the mesopause at 80–85 km (50–53 mi; 260,000–280,000 ft) above sea level.
Temperatures drop with increasing altitude to the mesopause that marks the top of this middle layer of the atmosphere. It is the coldest place on Earth and has an average temperature around −85 °C (−120 °F; 190 K).[11][12]
Just below the mesopause, the air is so cold that even the very scarce water vapor at this altitude can be sublimated into polar-mesospheric noctilucent clouds. These are the highest clouds in the atmosphere and may be visible to the naked eye if sunlight reflects off them about an hour or two after sunset or a similar length of time before sunrise. They are most readily visible when the Sun is around 4 to 16 degrees below the horizon. A type of lightning referred to as either sprites or ELVES, occasionally form far above tropospheric thunderclouds. The mesosphere is also the layer where most meteors burn up upon atmospheric entrance. It is too high above Earth to be accessible to aircraft and balloons, and too low to permit orbital spacecraft. The mesosphere is mainly accessed by sounding rockets.
Stratosphere
The stratosphere is the second-lowest layer of Earth's atmosphere. It lies above the troposphere and is separated from it by the tropopause. This layer extends from the top of the troposphere at roughly 12 km (7.5 mi; 39,000 ft) above Earth's surface to the stratopause at an altitude of about 50 to 55 km (31 to 34 mi; 164,000 to 180,000 ft).
The atmospheric pressure at the top of the stratosphere is roughly 1/1000 the pressure at sea level. It contains the ozone layer, which is the part of Earth's atmosphere that contains relatively high concentrations of that gas. The stratosphere defines a layer in which temperatures rise with increasing altitude. This rise in temperature is caused by the absorption of ultraviolet radiation (UV) radiation from the Sun by the ozone layer, which restricts turbulence and mixing. Although the temperature may be −60 °C (−76 °F; 210 K) at the tropopause, the top of the stratosphere is much warmer, and may be near 0 °C.[13]
The stratospheric temperature profile creates very stable atmospheric conditions, so the stratosphere lacks the weather-producing air turbulence that is so prevalent in the troposphere. Consequently, the stratosphere is almost completely free of clouds and other forms of weather. However, polar stratospheric or nacreous clouds are occasionally seen in the lower part of this layer of the atmosphere where the air is coldest. This is the highest layer that can be accessed by jet-powered aircraft.
Troposphere
The troposphere is the lowest layer of Earth's atmosphere. It extends from Earth's surface to an average height of about 12 km, although this altitude actually varies from about 9 km (30,000 ft) at the poles to 17 km (56,000 ft) at the equator,[9] with some variation due to weather. The troposphere is bounded above by the tropopause, a boundary marked in most places by a temperature inversion (i.e. a layer of relatively warm air above a colder one), and in others by a zone which is isothermal with height.[14][15]
Although variations do occur, the temperature usually declines with increasing altitude in the troposphere because the troposphere is mostly heated through energy transfer from the surface. Thus, the lowest part of the troposphere (i.e. Earth's surface) is typically the warmest section of the troposphere. This promotes vertical mixing (hence the origin of its name in the Greek word τρόπος, tropos, meaning "turn"). The troposphere contains roughly 80% of the mass of Earth's atmosphere.[16] The troposphere is denser than all its overlying atmospheric layers because a larger atmospheric weight sits on top of the troposphere and causes it to be most severely compressed. Fifty percent of the total mass of the atmosphere is located in the lower 5.6 km (18,000 ft) of the troposphere. It is primarily composed of nitrogen (78%) and oxygen (21%) with only small concentrations of other trace gases.
Nearly all atmospheric water vapor or moisture is found in the troposphere, so it is the layer where most of Earth's weather takes place. It has basically all the weather-associated cloud genus types generated by active wind circulation, although very tall cumulonimbus thunder clouds can penetrate the tropopause from below and rise into the lower part of the stratosphere. Most conventional aviation activity takes place in the troposphere, and it is the only layer that can be accessed by propeller-driven aircraft.
Other layers
Within the five principal layers that are largely determined by temperature, several secondary layers may be distinguished by other properties:
- The ozone layer is contained within the stratosphere. In this layer ozone concentrations are about 2 to 8 parts per million, which is much higher than in the lower atmosphere but still very small compared to the main components of the atmosphere. It is mainly located in the lower portion of the stratosphere from about 15–35 km (9.3–21.7 mi; 49,000–115,000 ft), though the thickness varies seasonally and geographically. About 90% of the ozone in Earth's atmosphere is contained in the stratosphere.
- The ionosphere is a region of the atmosphere that is ionized by solar radiation. It is responsible for auroras. During daytime hours, it stretches from 50 to 1,000 km (31 to 621 mi; 160,000 to 3,280,000 ft) and includes the mesosphere, thermosphere, and parts of the exosphere. However, ionization in the mesosphere largely ceases during the night, so auroras are normally seen only in the thermosphere and lower exosphere. The ionosphere forms the inner edge of the magnetosphere. It has practical importance because it influences, for example, radio propagation on Earth.
- The homosphere and heterosphere are defined by whether the atmospheric gases are well mixed. The surface-based homosphere includes the troposphere, stratosphere, mesosphere, and the lowest part of the thermosphere, where the chemical composition of the atmosphere does not depend on molecular weight because the gases are mixed by turbulence.[18] This relatively homogeneous layer ends at the turbopause found at about 100 km (62 mi; 330,000 ft), which places it about 20 km (12 mi; 66,000 ft) above the mesopause.
- Above this altitude lies the heterosphere, which includes the exosphere and most of the thermosphere. Here, the chemical composition varies with altitude. This is because the distance that particles can move without colliding with one another is large compared with the size of motions that cause mixing. This allows the gases to stratify by molecular weight, with the heavier ones, such as oxygen and nitrogen, present only near the bottom of the heterosphere. The upper part of the heterosphere is composed almost completely of hydrogen, the lightest element.
- The planetary boundary layer is the part of the troposphere that is closest to Earth's surface and is directly affected by it, mainly through turbulent diffusion. During the day the planetary boundary layer usually is well-mixed, whereas at night it becomes stably stratified with weak or intermittent mixing. The depth of the planetary boundary layer ranges from as little as about 100 meters on clear, calm nights to 3000 m or more during the afternoon in dry regions.
The average temperature of the atmosphere at Earth's surface is 14 °C (57 °F; 287 K)[19] or 15 °C (59 °F; 288 K),[20] depending on the reference.[21][22][23]
Physical properties
Pressure and thickness
The average atmospheric pressure at sea level is defined by the International Standard Atmosphere as 101325 pascals (760.00 Torr; 14.6959 psi; 760.00 mmHg). This is sometimes referred to as a unit of standard atmospheres (atm). Total atmospheric mass is 5.1480×10¹⁸ kg (1.135×10¹⁹ lb),[25] about 2.5% less than would be inferred from the average sea level pressure and Earth's area of 51007.2 megahectares, this portion being displaced by Earth's mountainous terrain. Atmospheric pressure is the total weight of the air above unit area at the point where the pressure is measured. Thus air pressure varies with location and weather.
If the entire mass of the atmosphere had a uniform density from sea level, it would terminate abruptly at an altitude of 8.50 km (27,900 ft). It actually decreases exponentially with altitude, dropping by half every 5.6 km (18,000 ft) or by a factor of 1/e every 7.64 km (25,100 ft), the average scale height of the atmosphere below 70 km (43 mi; 230,000 ft). However, the atmosphere is more accurately modeled with a customized equation for each layer that takes gradients of temperature, molecular composition, solar radiation and gravity into account.
In summary, the mass of Earth's atmosphere is distributed approximately as follows:[26]
- 50% is below 5.6 km (18,000 ft).
- 90% is below 16 km (52,000 ft).
- 99.99997% is below 100 km (62 mi; 330,000 ft), the Kármán line. By international convention, this marks the beginning of space where human travelers are considered astronauts.
By comparison, the summit of Mt. Everest is at 8,848 m (29,029 ft); commercial airliners typically cruise between 10 km (33,000 ft) and 13 km (43,000 ft) where the thinner air improves fuel economy; weather balloons reach 30.4 km (100,000 ft) and above; and the highest X-15 flight in 1963 reached 108.0 km (354,300 ft).
Even above the Kármán line, significant atmospheric effects such as auroras still occur. Meteors begin to glow in this region though the larger ones may not burn up until they penetrate more deeply. The various layers of Earth's ionosphere, important to HF radio propagation, begin below 100 km and extend beyond 500 km. By comparison, theInternational Space Station and Space Shuttle typically orbit at 350–400 km, within the F-layer of the ionosphere where they encounter enough atmospheric drag to require reboosts every few months. Depending on solar activity, satellites can experience noticeable atmospheric drag at altitudes as high as 700–800 km.
Temperature and speed of sound
The division of the atmosphere into layers mostly by reference to temperature is discussed above. Temperature decreases with altitude starting at sea level, but variations in this trend begin above 11 km, where the temperature stabilizes through a large vertical distance through the rest of the troposphere. In the stratosphere, starting above about 20 km, the temperature increases with height, due to heating within the ozone layer caused by capture of significant ultraviolet radiation from the Sun by the dioxygen and ozone gas in this region. Still another region of increasing temperature with altitude occurs at very high altitudes, in the aptly-named thermosphereabove 90 km.
Because in an ideal gas of constant composition the speed of sound depends only on temperature and not on the gas pressure or density, the speed of sound in the atmosphere with altitude takes on the form of the complicated temperature profile (see illustration to the right), and does not mirror altitudinal changes in density or pressure.
Density and mass
The density of air at sea level is about 1.2 kg/m3 (1.2 g/L). Density is not measured directly but is calculated from measurements of temperature, pressure and humidity using the equation of state for air (a form of the ideal gas law). Atmospheric density decreases as the altitude increases. This variation can be approximately modeled using the barometric formula. More sophisticated models are used to predict orbital decay of satellites.
The average mass of the atmosphere is about 5 quadrillion (5×10¹⁵) tonnes or 1/1,200,000 the mass of Earth. According to the American National Center for Atmospheric Research, "The total mean mass of the atmosphere is 5.1480×10¹⁸ kg with an annual range due to water vapor of 1.2 or 1.5×10¹⁵ kg depending on whether surface pressure or water vapor data are used; somewhat smaller than the previous estimate. The mean mass of water vapor is estimated as 1.27×10¹⁶ kg and the dry air mass as 5.1352 ±0.0003×10¹⁸ kg."
Optical properties

This section does not cite any references (sources). (October 2013) Solar radiation (or sunlight) is the energy Earth receives from the Sun. Earth also emits radiation back into space, but at longer wavelengths that we cannot see. Part of the incoming and emitted radiation is absorbed or reflected by the atmosphere.
Scattering
When light passes through Earth's atmosphere, photons interact with it through scattering. If the light does not interact with the atmosphere, it is called direct radiation and is what you see if you were to look directly at the Sun. Indirect radiation is light that has been scattered in the atmosphere. For example, on an overcast day when you cannot see your shadow there is no direct radiation reaching you, it has all been scattered. As another example, due to a phenomenon called Rayleigh scattering, shorter (blue) wavelengths scatter more easily than longer (red) wavelengths. This is why the sky looks blue; you are seeing scattered blue light. This is also why sunsets are red. Because the Sun is close to the horizon, the Sun's rays pass through more atmosphere than normal to reach your eye. Much of the blue light has been scattered out, leaving the red light in a sunset.
Absorption
Different molecules absorb different wavelengths of radiation. For example, O2 and O3 absorb almost all wavelengths shorter than 300 nanometers. Water (H2O) absorbs many wavelengths above 700 nm. When a molecule absorbs a photon, it increases the energy of the molecule. This heats the atmosphere, but the atmosphere also cools by emitting radiation, as discussed below.
The combined absorption spectra of the gases in the atmosphere leave "windows" of low opacity, allowing the transmission of only certain bands of light. The optical window runs from around 300 nm (ultraviolet-C) up into the range humans can see, the visible spectrum (commonly called light), at roughly 400–700 nm and continues to the infrared to around 1100 nm. There are also infrared andradio windows that transmit some infrared and radio waves at longer wavelengths. For example, the radio window runs from about one centimeter to about eleven-meter waves.
Emission
Emission is the opposite of absorption, it is when an object emits radiation. Objects tend to emit amounts and wavelengths of radiation depending on their "black body" emission curves, therefore hotter objects tend to emit more radiation, with shorter wavelengths. Colder objects emit less radiation, with longer wavelengths. For example, the Sun is approximately 6,000 K (5,730 °C; 10,340 °F), its radiation peaks near 500 nm, and is visible to the human eye. Earth is approximately 290 K (17 °C; 62 °F), so its radiation peaks near 10,000 nm, and is much too long to be visible to humans.
Because of its temperature, the atmosphere emits infrared radiation. For example, on clear nights Earth's surface cools down faster than on cloudy nights. This is because clouds (H2O) are strong absorbers and emitters of infrared radiation. This is also why it becomes colder at night at higher elevations.
The greenhouse effect is directly related to this absorption and emission effect. Some gases in the atmosphere absorb and emit infrared radiation, but do not interact with sunlight in the visible spectrum. Common examples of these are CO2 and H2O.
Refractive index
The refractive index of air is close to, but just greater than 1. Systematic variations in refractive index can lead to the bending of light rays over long optical paths. one example is that, under some circumstances, observers onboard ships can see other vessels just over the horizon because light is refracted in the same direction as thecurvature of Earth's surface.
The refractive index of air depends on temperature, giving rise to refraction effects when the temperature gradient is large. An example of such effects is the mirage.
Circulation
Atmospheric circulation is the large-scale movement of air through the troposphere, and the means (with ocean circulation) by whichheat is distributed around Earth. The large-scale structure of the atmospheric circulation varies from year to year, but the basic structure remains fairly constant because it is determined by Earth's rotation rate and the difference in solar radiation between the equator and poles.
Evolution of Earth's atmosphere
Earliest atmosphere
The first atmosphere would have consisted of gases in the solar nebula, primarily hydrogen. In addition, there would probably have been simple hydrides such as those now found in the gas giants (Jupiter and Saturn), notably water vapor, methane and ammonia. As the solar nebula dissipated, these gases would have escaped, partly driven off by the solar wind.[28]
Second atmosphere
Outgassing from volcanism, supplemented by gases produced during the late heavy bombardment of Earth by huge asteroids, produced the next atmosphere, consisting largely of nitrogen plus carbon dioxide and inert gases.[28] A major part of carbon-dioxide emissions soon dissolved in water and built up carbonate sediments.
Researchers have found water-related sediments dating from as early as 3.8 billion years ago.[29] About 3.4 billion years ago, nitrogen formed the major part of the then stable "second atmosphere". An influence of life has to be taken into account rather soon in the history of the atmosphere, because hints of early life-forms appear as early as 3.5 billion years ago.[30] How Earth at that time maintained a climate warm enough for liquid water and life, if the early Sun put out 30% lower solar radiance than today, is a puzzle known as the "faint young Sun paradox".
The geological record however shows a continually relatively warm surface during the complete early temperature record of Earth - with the exception of one cold glacial phase about 2.4 billion years ago. In the late Archean eon an oxygen-containing atmosphere began to develop, apparently produced by photosynthesizing cyanobacteria (seeGreat Oxygenation Event), which have been found as stromatolite fossils from 2.7 billion years ago. The early basic carbon isotopy (isotope ratio proportions) very much approximates current conditions, suggesting that the fundamental features of the carbon cycle became established as early as 4 billion years ago.
Ancient sediments in the Republic of Gabon dating from between about 2,150 and 2,080 million years ago provide a record of Earth's dynamic oxygenation evolution. These fluctuations in oxygenation were likely driven by the Lomagundi carbon isotope excursion.[31]
Third atmosphere
The constant re-arrangement of continents by plate tectonics influences the long-term evolution of the atmosphere by transferring carbon dioxide to and from large continental carbonate stores. Free oxygen did not exist in the atmosphere until about 2.4 billion years ago during the Great Oxygenation Event and its appearance is indicated by the end of the banded iron formations. Before this time, any oxygen produced by photosynthesis was consumed by oxidation of reduced materials, notably iron. Molecules of free oxygen did not start to accumulate in the atmosphere until the rate of production of oxygen began to exceed the availability of reducing materials. This point signifies a shift from a reducing atmosphere to an oxidizing atmosphere. O2 showed major variations until reaching a steady state of more than 15% by the end of the Precambrian.[32] The following time span from 541 million years ago to the present day is thePhanerozoic eon, during the earliest period of which, the Cambrian, oxygen-requiring metazoan life forms began to appear.
The amount of oxygen in the atmosphere has fluctuated over the last 600 million years, reaching a peak of about 30% around 280 million years ago, significantly higher than today's 21%. Two main processes govern changes in the atmosphere: Plants use carbon dioxide from the atmosphere, releasing oxygen. Breakdown of pyrite and volcanic eruptions release sulfur into the atmosphere, which oxidizes and hence reduces the amount of oxygen in the atmosphere. However, volcanic eruptions also release carbon dioxide, which plants can convert to oxygen. The exact cause of the variation of the amount of oxygen in the atmosphere is not known. Periods with much oxygen in the atmosphere are associated with rapid development of animals. Today's atmosphere contains 21% oxygen, which is high enough for this rapid development of animals.[33]
The scientific consensus is that the anthropogenic greenhouse gases currently accumulating in the atmosphere are the main cause ofglobal warming.[34]
Air pollution
Air pollution is the introduction into the atmosphere of chemicals, particulate matter or biological materials that cause harm or discomfort to organisms.[35] Stratospheric ozone depletion is caused by air pollution, chiefly from chlorofluorocarbons and other ozone-depleting substances.
Images from space
On October 19, 2015 NASA started a website containing daily images of the full sunlit side of the Earth on http://epic.gsfc.nasa.gov/. The images are taken from the Deep Space Climate Observatory (DSCOVR) and show Earth as it rotates during a day.[36]
 Blue light is scattered more than other wavelengths by the gases in the atmosphere, giving Earth a blue halo when seen from space.
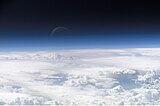
 Limb view, of Earth's atmosphere. Colors roughly denote the layers of the atmosphere.
 This image shows the moon at centre, with the limb of Earth near the bottom transitioning into the orange-colored troposphere. The troposphere ends abruptly at the tropopause, which appears in the image as the sharp boundary between the orange- and blue-colored atmosphere. The silvery-bluenoctilucent clouds extend far above Earth's troposphere.
 Earth's atmosphere backlit by the Sun in aneclipse observed fromdeep space onboardApollo 12 in 1969.
See also
- Aerial perspective
- Air (classical element)
- Air glow
- Airshed
- Atmosphere (for information on atmospheres in general)
- Atmospheric dispersion modeling
- Atmospheric electricity
- Atmospheric models
- Atmospheric Radiation Measurement (ARM) (in the U.S.)
- Atmospheric stratification
- Aviation
- Biosphere
- Carbon dioxide in Earth's atmosphere
- Compressed air
- COSPAR international reference atmosphere (CIRA)
- Environmental impact of aviation
- Global dimming
- Historical temperature record
- Hydrosphere
- Hypermobility (travel)
- Kyoto Protocol
- Leaching (agriculture)
- Lithosphere
- Standard Dry Air
- U.S. Standard Atmosphere
- Warm period
- Water vapor in Earth's atmosphere
References
- ^ Zimmer, Carl (3 October 2013). "Earth’s Oxygen: A Mystery Easy to Take for Granted". New York Times. Retrieved 3 October 2013.
- ^ Lide, David R. Handbook of Chemistry and Physics. Boca Raton, FL: CRC, 1996: 14-7
- ^ [1] Ultraviolet radiation in the solar system By Manuel Vázquez, Arnold Hanslmeier
- ^ a b Wallace, John M. and Peter V. Hobbs. Atmospheric Science; An Introductory Survey.Elsevier. Second Edition, 2006. ISBN 978-0-12-732951-2. Chapter 1
- ^ "Trace Gases". Ace.mmu.ac.uk. Archived from the original on 9 October 2010. Retrieved 2010-10-16.
- ^ Source for figures: Carbon dioxide, NOAA Earth System Research Laboratory, (updated 2013-03). Methane, IPCC TAR table 6.1, (updated to 1998). The NASA total was 17 ppmv over 100%, and CO2 was increased here by 15 ppmv. To normalize, N2should be reduced by about 25 ppmv and O2 by about 7 ppmv.
- ^ http://www.nasa.gov/mission_pages/sunearth/science/mos-upper-atmosphere.html#.VHg5AzHF8vY
- ^ a b Randy Russell (2008). "The Thermosphere". Retrieved 2013-10-18.
- ^ a b "The height of the tropopause". Das.uwyo.edu. Retrieved 2012-04-18.
- ^ Ahrens, C. Donald. Essentials of Meteorology. Published by Thomson Brooks/Cole, 2005.
- ^ States, Robert J.; Gardner, Chester S. (January 2000). "Thermal Structure of the Mesopause Region (80–105 km) at 40°N Latitude. Part I: Seasonal Variations". Journal of the Atmospheric Sciences 2000 57: 66–77. Bibcode:2000JAtS...57...66S.doi:10.1175/1520-0469(2000)057<0066:TSOTMR>2.0.CO;2.
- ^ Joe Buchdahl. "Atmosphere, Climate & Environment Information Programme". Ace.mmu.ac.uk. Retrieved 2012-04-18.
- ^ Journal of the Atmospheric Sciences (1993). "stratopause". Retrieved 2013-10-18.
- ^ Barry, R.G. & Chorley R.J. (1971). Atmosphere, Weather and Climate. London, Menthuen & Co Ltd., p. 65
- ^ Tyson, P.D., Preston-Whyte, R.A. (2013). The Weather and Climate of Southern Africa.(Second Edition). Oxford, Oxford University Press. p. 4.
- ^ McGraw-Hill Concise Encyclopedia of Science & Technology. (1984). Troposphere. "It contains about four-fifths of the mass of the whole atmosphere."
- ^ "ISS022-E-062672 caption". NASA. Retrieved 21 September 2012.
- ^ "''homosphere''—AMS Glossary". Amsglossary.allenpress.com. Archived from the original on 14 September 2010. Retrieved 2010-10-16.
- ^ "Earth's Atmosphere".
- ^ "NASA — Earth Fact Sheet". Nssdc.gsfc.nasa.gov. Archived from the original on 30 October 2010. Retrieved 2010-10-16.
- ^ "Global Surface Temperature Anomalies".
- ^ "Earth's Radiation Balance and Oceanic Heat Fluxes".
- ^ "Coupled Model Intercomparison Project Control Run" (PDF).
- ^ Geometric altitude vs. temperature, pressure, density, and the speed of sound derived from the 1962 U.S. Standard Atmosphere.
- ^ "The Mass of the Atmosphere: A Constraint on Global Analyses". Ams.allenpress.com. 1970-01-01. Retrieved 2010-10-16.
- ^ Lutgens, Frederick K. and Edward J. Tarbuck (1995) The Atmosphere, Prentice Hall, 6th ed., pp14-17, ISBN 0-13-350612-6
- ^ "Atmospheric Temperature Trends, 1979-2005 : Image of the Day". Earthobservatory.nasa.gov. 2000-01-01. Retrieved 2014-06-10.
- ^ a b Zahnle, K.; Schaefer, L.; Fegley, B. (2010). "Earth's Earliest Atmospheres". Cold Spring Harbor Perspectives in Biology 2 (10): a004895.doi:10.1101/cshperspect.a004895. PMC 2944365. PMID 20573713.
- ^ B. Windley: The Evolving Continents. Wiley Press, New York 1984
- ^ J. Schopf: Earth's Earliest Biosphere: Its Origin and Evolution. Princeton University Press, Princeton, N.J., 1983
- ^ Timothy W. Lyons, Christopher T. Reinhard & Noah J. Planavsky (20143). "Atmospheric oxygenation three billion years ago". Nature 506 (7488).Bibcode:2014Natur.506..307L. doi:10.1038/nature13068. Check date values in:
|date=(help) - ^ Christopher R. Scotese, Back to Earth History : Summary Chart for the Precambrian, Paleomar Project
- ^ Peter Ward:[2] Out of Thin Air: Dinosaurs, Birds, and Earth's Ancient Atmosphere
- ^ "Summary for Policymakers" (PDF). Climate Change 2007: The Physical Science Basis. Contribution of Working Group I to the Fourth Assessment Report of the Intergovernmental Panel on Climate Change. Intergovernmental Panel on Climate Change. 5 February 2007.
- ^ Starting from [3] Pollution—Definition from the Merriam-Webster online Dictionary
- ^ Northon, Karen. "Daily Views of Earth Available on New NASA Website". NASA. Retrieved 2015-10-21.
External links
Ignacia, Sandra; Jiménez, Ramírez (2014). Peter M.H. Kroneck and Martha E. Sosa Torres, ed. The Metal-Driven Biogeochemistry of Gaseous Compounds in the Environment. Metal Ions in Life Sciences 14. Springer. pp. 1–14 The Early Earth Atmosphere and Early Life Catalysts. doi:10.1007/978-94-017-9269-1_1.

Wikimedia Commons has media related to Earth's atmosphere. 
Wikiquote has quotations related to: Air - NASA's Earth Fact Sheet
- American Geophysical Union: Atmospheric Sciences
- Outreach of the GEOmon project See how Earth atmosphere is observed and monitored by a European project that combines many approaches.
- Layers of the Atmosphere
- Answers to several questions of curious kids related to Air and Atmosphere
- The AMS Glossary of Meteorology
- Paul Crutzen Interview Free video of Paul Crutzen Nobel Laureate for his work on decomposition of ozone talking to Harry Kroto Nobel Laureate by the Vega Science Trust.
[show] Earth's atmosphere[show] [show] [show] '사람되기 > 인문학' 카테고리의 다른 글
(인문학) 2015년도 독서 목록 (0) 2015.10.31 (인문학) United States Congress (미의회) (영문자료) (0) 2015.10.31 (인문학) 엔코미엔다 (Encomienda) (영문자료) (0) 2015.10.31 (인문학) 미국의회 (0) 2015.10.31 (인문학) 미 상원의원 버니 샌더스(Bernie Sanders) (영문자료) (0) 2015.10.31


